Displaying graphs over a specified time period
![]() The graphs page has some buttons to allow quick viewing of the graphs over periods of 1 year, 3 years or 5 years. Clicking the buttons will automatically align the graphs to these periods.
The graphs page has some buttons to allow quick viewing of the graphs over periods of 1 year, 3 years or 5 years. Clicking the buttons will automatically align the graphs to these periods.
![]() The "All" button will display all data available for any graph - the time periods will therefore become desynchronised if there is more data available for one graph than another.
The "All" button will display all data available for any graph - the time periods will therefore become desynchronised if there is more data available for one graph than another.
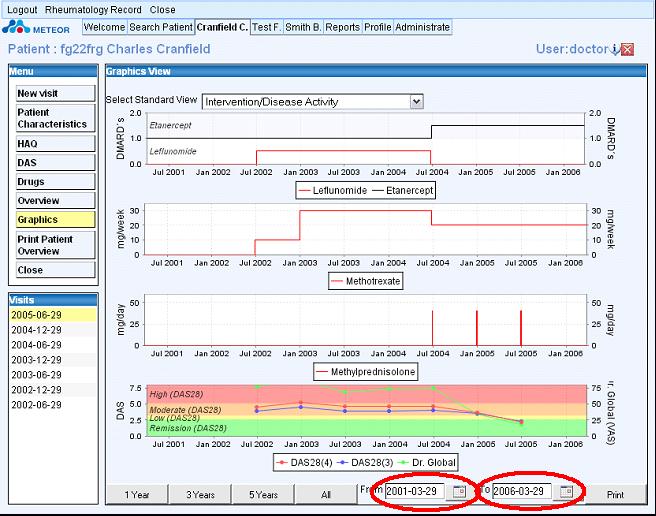
![]() To display the graphs over a specified timeframe, the dates should be entered in the from and to boxes, as indicated in the diagram below - the time period shown here is from March 2001 until March 2006:
To display the graphs over a specified timeframe, the dates should be entered in the from and to boxes, as indicated in the diagram below - the time period shown here is from March 2001 until March 2006:

![]()
© 2007 The METEOR Foundation, all rights reserved